The tides do not tick-tock
to our diurnal clock
in their steady march
across the times of day.
Our daily rhythms are joined
in rolling harmonies;
today the rocky spit
is covered at morning coffee,
tomorrow the waves break and foam.
The ocean's song evolves,
the earth, moon, and sun
tuning the great liquid bell
in geologic time.
Two months on the Panamanian Pacific coast. The beach is right below us, the surf a constant presence.
Living right on the ocean has it’s great benefits. The beaches are strikingly beautiful; the surf intermingles black volcanic and white sand into fantastic patterns visible from space (or at least in Google Earth and maps). The ocean has shaped the beaches into a steeply sloped upper section, and a nearly flat lower zone wonderful for all types of activities. A time lapse video of the receding high tide in the early morning is above.
It's hot. Not absolutely blisteringly hot, but hot enough to avoid strenuous outdoor activities during the middle of the day.
The tides are quite high, averaging almost 15 feet. It's important to know the tides so that you can plan your beach activities.
Fortunately, the local community has posted the tides online in a series of web pages, one for each month; March, 2012's page is here.
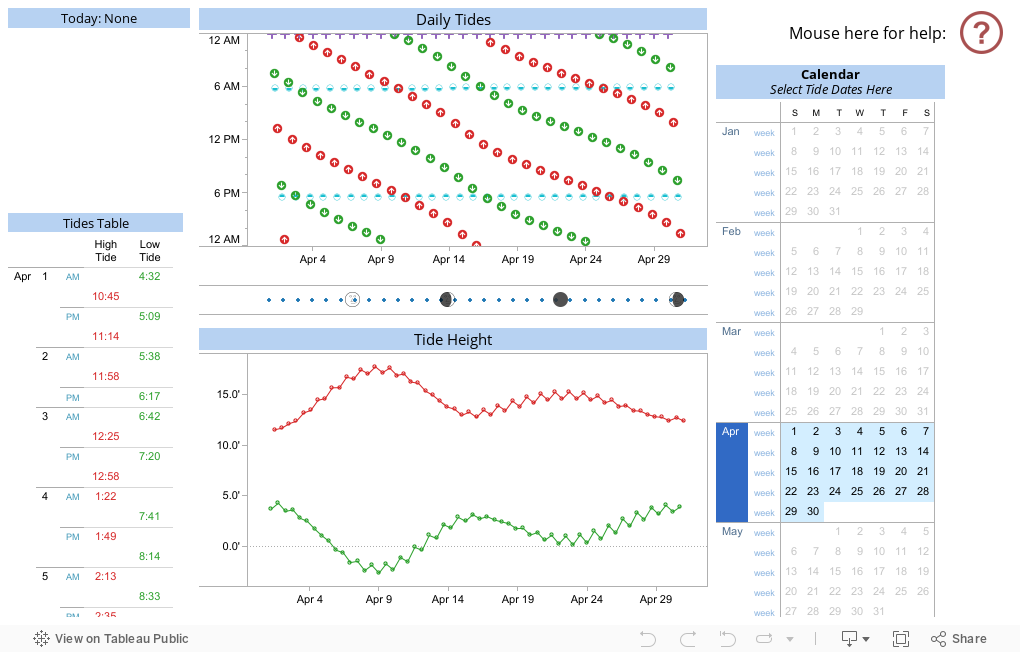
Unfortunately, the tides are presented in a table that, although it contains the data, is minimally useful. As shown for April 2012 (partial) below, in addition to the obvious analytical impediment of it being a table, each Months' tides are presented on a separate page, and the time and height values are commingled in the table's cells.

I was faced with the classic BI situation: plenty of data, little insight. My challenge was to come to grips with the data and render it in an engaging, approachable form that provides the information people need.
What to do? What to do?
Rhythm and Pulse of the Tides
I grew up in Shelburne, Nova Scotia, with one of the best harbours in the world at the end of my yard. Next door was a shipyard where the last of the wooden open ocean commercial fishing boats were built by men using centuries-old traditional methods.
My boyhood was spent at the ocean's edge. I was a pirate, sailor, fisherman, an explorer sailing off for exotic lands.
The tides were as much a part of life as mealtimes, school hours, and all the other regularly scheduled daily activities. Knowing when the tides were high and low, and when to expect them to be bigger and smaller mattered. For me it controlled the size of my playground, for many people knowing the tides was central to their existence.
People born to the ocean know the tides. They don't need graphs and charts and tables and schedules. The tides infuse life, their rhythms organically intertwined.
Here on the Panamanian Pacific coast the information about the tides is much for more prosaic uses, at least for the recreational ocean users. At low tide the beach is available for all manner of recreational activities. At high tide there's much less opportunity, e.g. it's really difficult to run on steeply sloped soft sand. At very high tides there's virtually no beach.
Knowing whether you'll be able to run on the beach at sunup, after coffee and before breakfast, is nice.
Knowing where the tides will be for this week, next week, next month, helps to plan your activities.
How to help people understand the tides? Understanding them not as a list of figures in a table, but as the dynamic, regular, but variable system they are.
How to help people internalize the nature of the tides, so that they can adapt to their ebbs and flows, risings and fallings? Their rhythms.
Enter Tableau
Once the data's available it's straightforward to do some basic visualization with Tableau. Straight away it becomes obvious that there are regular patterns to the tides. High and low tide times move forward from day to day, the time from high to low a little over six hours.
What We See
The tides are the long, slow, resonant beat of the gravitational dance between the Earth and the Moon, with harmony from the Sun. The dance is eons old; the partners know each other well, their movements intimate and comfortable.
Visualizing the tides with Tableau clearly reveals their dynamic structure. Although there is a regularity to their oscillations they are not strictly mated to the cycles of day and night. The tidal patterns stand out clearly in these visualizations, confirming and exposing our innate sense of the tides' haughty disregard for our clocks and convenience.
Daily Tides
Daily Tides shows the tides wrapping themselves around the days in a double helix. The large scale structure mirrors the Earth's rotation, the tides the ocean's response to the moon's beckoning.
The vizualization clearly maps the tides to the 24 hour day, advancing by almost an hour from each day to the next. If low tide at sunup is your pleasure, you're in luck—it comes around every sixth day. If you like high tides, they occur a little over 6 hours apart.
Tide Height
In their celestial dance the moon swings close, pulling the tides higher, then steps back, letting the tides subside. All the while the Sun smiles, attracting and influencing the oceans—sometimes in step with the Moon, sometimes not.
The polyrhythms of the dance—Earth's rotation withn the Moon's orbit, both in Solar orbit, show up clearly in the eternal cycling of the tides high then low then high.
Earth - Moon - Sun Tidal Relationship
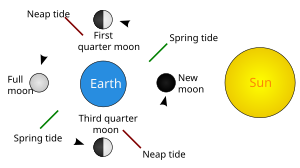
source: Wikimedia
Beautiful, and useful, at once. thank you!
ReplyDeleteChris, is the tide data that drives this viz in a general form you've found for other locations? I would love to point your excellent viz at a set of data for Wellfleet MA where I live
ReplyDeletethanks very much for your large information .and knowledge full description . i think it is sus a topi that many kinds of people face many problem. thanks for this.
ReplyDeleteInformation visualization Low
Tide data always useful to fishing and You can find the high and low tide data from thousands of tide locations around the world.
ReplyDelete